Mission Impossible: Let Binary Analysis Turn Black Box into White
Today, there are two key approaches to searching for vulnerabilities in apps: static and dynamic application security testing, with each having pros and cons. The market is currently inclined to employ both approaches since they solve slightly different tasks and give different results. However, SAST use is restricted in some cases, for example, when source code is unavailable. In this post, we’ll talk about a rather rare but very beneficial technology that combines SAST and DAST advantages — st
Content
Make Your Applications Secure Today
Sign up for a personalized demo to see how DerScanner can meet your Application Security needs
Today, there are two key approaches to searching for vulnerabilities in apps: static and dynamic application security testing, with each having pros and cons. The market is currently inclined to employ both approaches since they solve slightly different tasks and give different results. However, SAST use is restricted in some cases, for example, when source code is unavailable. In this post, we’ll talk about a rather rare but very beneficial technology that combines SAST and DAST advantages — static analysis of executable code.
We live in the IT era when the world web and Internet technologies rapidly penetrate all spheres of human life, with cybercrime becoming increasingly common.
Application vulnerability has become a serious problem: according to the US Department of Homeland Security, more than 90% of successful cyberattacks exploit app vulnerabilities. The most common exploitation methods are:
- SQL code injection
- Buffer overflow
- Cross-site scripting
- Insecure configuration use
Software analysis for undocumented features and vulnerabilities is a key process behind application security.
There are two classic and well-established technologies to analyze software for vulnerabilities and undocumented features (i.e. check cybersecurity compliance):
Another option is IAST (where “I” stands for “Interactive”), although it is dynamic per se (during analysis, additional agent monitors application execution). While RASP (Runtime Application Self-Protection) is sometimes mentioned among analysis tools, it is used more for protection than analysis.
DAST (blackbox method) is used for runtime software testing and has the following advantages:
- Since vulnerabilities are in an executable program and detecting a bug means exploiting it, there are fewer false positives compared to SAST.
- AST doesn’t need a source code to do the job.
At the same time, it has drawbacks:
- Due to gaps in code coverage, you may miss some vulnerabilities. For example, DAST cannot detect vulnerabilities related to weak cryptography or time bombs.
- You have to run an application, which may be difficult sometimes due to sophisticated configuration and the requirements for various integrations. Moreover, while you need to reproduce production environment to obtain the most reliable results, this is almost impossible without damaging the software.
SAST (whitebox method) means testing without running a software.
Let’s look at its advantages.
- Complete code coverage helps find more vulnerabilities.
- No dependency on the environment where the software will be run.
- Testing can be conducted at the initial stages of code writing, when no executables exist yet. This allows for flexible integration into SDLC (Software Development Life Cycle) right from the start of development.
The only drawback is false positive proneness as you have to double check whether an analyzer shows an actual bug or just a false positive.
As we can see, both analysis methods have their advantages and shortcomings. So, is there a way to benefit from their strengths, while minimizing their weaknesses? Yes, there is. Simply use binary analysis, i.e. vulnerability search of executables via SAST.
Binary analysis, or executables analysis technology
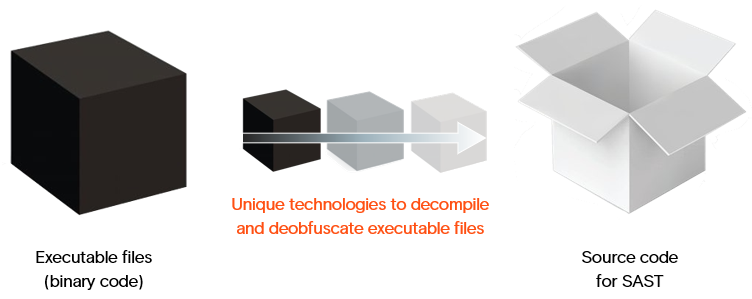
Binary analysis allows SAST to be run without a source code, for example, in the case of a third-party contractor’s code. Moreover, you’ll get complete code coverage, thus avoiding this DAST shortcoming. With binary analysis, you can check third-party libraries employed during development and lacking a source code. In addition, this is a good way to double check your release by comparing analysis results of a source code from a repository and an executable code from a production server.
During binary analysis, a binary image is converted into an intermediate representation (internal representation or code model) for further analysis. Then, the SAST algorithms are applied to this internal representation. As a result, a current model is complemented with information required for further vulnerability and undocumented feature detection. At the next stage, vulnerability and undocumented feature search rules are applied.
Unlike source code analysis, where compilation theory elements (lexical and syntax analysis) are used to build a model, binary analysis uses reverse engineering theory: disassembling, decompilation, and deobfuscation.
A few words about the terms used
We are now talking about analyzing executable files that lack debug info. With debug info, the task is much easier. However, if you have debug info, then you most likely have a source code too, so the task becomes irrelevant.
In this post, Java bytecode analysis is also called a binary one. Although not completely correct, this helps to make things easier to understand. Of course, JVM bytecode is easier to analyze than C/C++ and Objective-C/Swift binary code. However, in general, bytecode and binary code analysis are similar. The main challenges described in the post refer to binary code analysis.
Decompilation means source code recovery from a binary code. Here, we can speak of reverse engineering elements, such as disassembling (obtaining assembler code from a binary image), assembler translation into a three-address code or another representation, and restoring source code structures.
Obfuscation refers to transformations that leave source code functionality intact, but which make it difficult to decompile and understand the resulting binary image. An inverse transformation is called deobfuscation. Obfuscation can be applied to both source and binary codes.
How to view the results?
Surprisingly, the question of how to view binary analysis findings is usually asked first.
For a binary code analyst, it is important to map vulnerabilities and undocumented features to a source code. To this end, deobfuscation (if obfuscation was used) and decompilation of a binary code into a source code are run at the final stage. In other words, vulnerabilities can be seen in a decompiled code.
During decompilation, even of a JVM bytecode, not all information is restored correctly, with analysis thus being applied to a near-binary code representation. Therefore, a question arises: once you detect vulnerabilities in a binary code, how can they be localized in a source code? We described how to solve this problem for a JVM bytecode in our post about Java bytecode vulnerability searching. For a binary code, the solution is similar, so it’s just a technical matter.
Once again: we are talking about analyzing a code without debug info. If debug info is available, the task becomes much simpler.
We are often asked whether a decompiled code is sufficient to understand and localize the vulnerability.

So, here are some points we would like to share on the matter:
- If we are talking about using JVM bytecode in general, the answer is “yes” since bytecode decompilation quality is high and in almost any case you can figure out what the vulnerability is.
- Reliable vulnerability localization can be hindered by a simple obfuscation, such as renaming of classes and functions. In real life, however, it often turns out that understanding a vulnerability is more important than finding the file in which it is located. Localization is needed when there is someone who can fix a vulnerability. In such event, a developer can also use a decompiled code to determine the location of the vulnerability.
- When it comes to analyzing a binary code (for example, C++), everything is more complicated, of course. There is no tool to completely restore a random C++ code. However, in our case, we do not need to compile the code later. We just need sufficient quality to understand a vulnerability.
- Usually, such decompilation quality can be achieved. This requires tackling a lot of complicated, yet solvable, problems (see below for more detail).
- For C/C++, vulnerability localization is even more difficult since symbol names are heavily abbreviated during compilation and cannot be restored.
- In Objective-C, the situation is slightly better: function names remain available, thus simplifying vulnerability localization.
- Obfuscation matters stand apart, with complex transformations sometimes making it more difficult to decompile the code and map vulnerabilities. In real life, however, it turns out that a good decompiler can cope with most obfuscating transformations (remember that we need sufficient code quality to understand a vulnerability).
Conclusion: a vulnerability can usually be shown in such a way that it can be understood and verified.
Binary analysis challenges and specifics
We won’t talk about bytecode here since it has already been covered in this post. Here comes the most interesting part: analyzing a real binary code, with C/C++, Objective-C and Swift being taken as examples.
Disassembling becomes rather challenging. Here it is important to divide a binary image into subroutines. Subsequent extraction of assembler instructions from the subroutines is a purely technical matter.
As an example, let’s take x86 architecture, where instructions don`t have a fixed length. There is no clear division into code and data sections in binary images: import tables and virtual function tables may be located within code section, while jump tables are found between basic function blocks in a code section. So, you need to be able to separate code from data and understand where subroutines begin and end.
There are two common methods to identify subroutine start addresses. In the first method, they are identified by a standard prologue (for x86, they are push ebp; mov ebp, esp). In the second method, a code section is recursively traversed from the entry point with recognition of subroutine call instructions. Traversal is performed by recognizing jump instructions. A combined method is also used when a recursive traversal is launched from start addresses found by prologues.
In the real world, such approaches return a rather poor percentage of recognized code since not all functions have standard prologues, with indirect calls and jumps also being in place.
You can improve basic algorithms as follows:
- In a large test image base, find a more accurate prologue list (new prologues or variations of standard ones).
- You may automatically find virtual function tables and take subroutine start addresses from them.
- Subroutine start addresses and some other structures can be found via binary code segments related to the exception handling mechanism.
- To verify these start addresses, search for them in the image or recognize call instructions.
- To search for boundaries, you may recursively traverse a subroutine, while recognizing instructions from the start address. There are some challenges when it comes to indirect jumps and no-return functions. Import table analysis and switch structure recognition can help here.
To be able to reliably find vulnerabilities later, you should do one more important thing during reverse engineering – recognize standard functions in a binary image. Standard functions may be either statically linked to the image or included as inline functions. The main recognition algorithm is searching by signature with variations. The adapted Aho-Corasick algorithm can be used as such solution. To collect signatures, you need to first analyze the library images built under various conditions and select non-changing bytes from them.
What to do next?
In the previous section, we discussed disassembling, the first stage of binary code reverse engineering. Although initial, this is a mission-critical stage, since losing some code during disassembling may dramatically affect analysis results.
There is a lot going on next. A list of key tasks is provided below, albeit briefly since the details relate to either know-how & trade secrets or unexciting technical and engineering solutions.
- Converting an assembler code into intermediate representation for analysis. Various bytecodes can be used. For C-family, LLVM seems to be a good choice. It is actively supported and developed by the community and has a rather mature infrastructure, including the one needed for SAST. At this stage, there are a lot of details to pay attention to. For example, you must detect which variables are addressed in the stack to avoid overburdening the resulting view with entities. You then must configure the optimal mapping of assembler instruction sets to bytecode instructions.
- Restoring high-level structures (such as loops and branches). The more accurately you restore original structures from the assembler code, the better analysis quality will be. Restoring such structures requires applying graph theory elements to CFG (Control Flow Graph) and other graphical representations of the program.
- When executing SAST algorithms, it’s not very important whether we have obtained an internal representation from a source or binary code. In either case, we must build CFG and apply data flow analysis algorithms, as well as other static analysis algorithms. While there are certain specifics when analyzing a representation obtained from a binary code, they are mostly technical.
We have talked about how to perform SAST when no source code is available. While in great demand (as we can see from customer communications), the technology is rarely used since binary analysis is a challenging task calling for complex high-tech SAST and reverse engineering algorithms.
Ready to Reduce Technical Debt and
Improve Security?
Clean code. Fewer risks. Stronger software